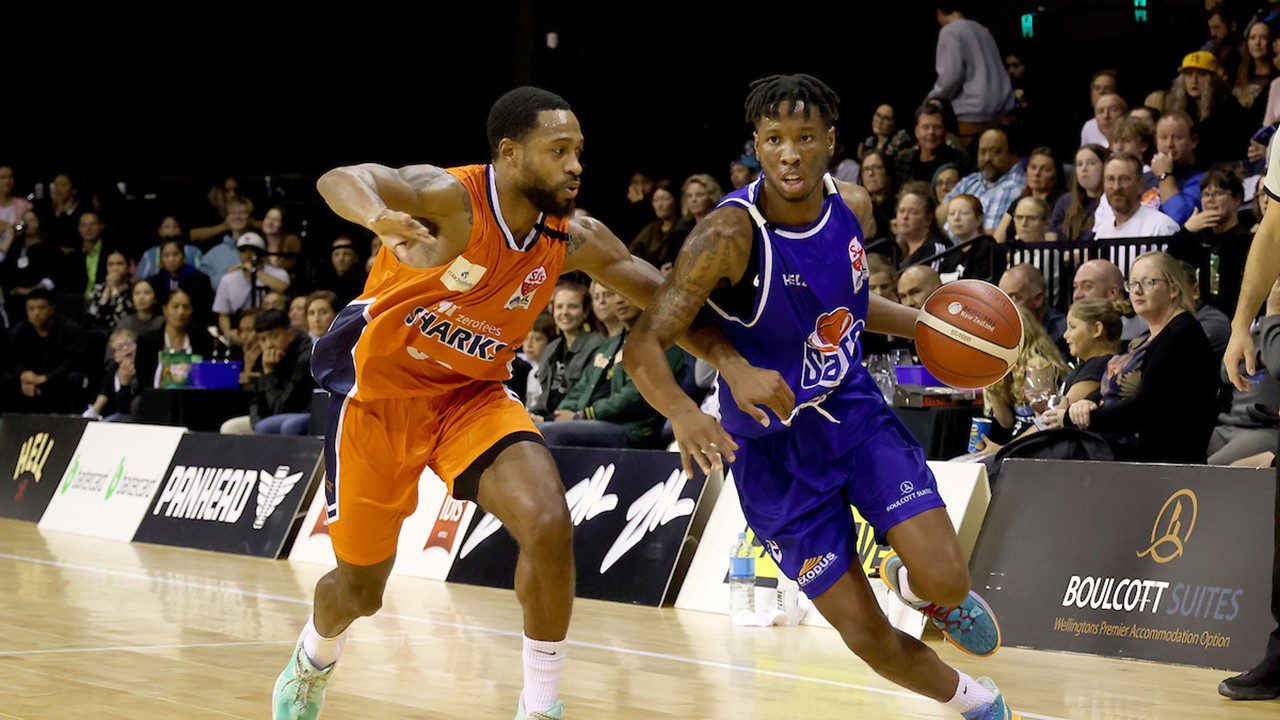
This week in Fast Five we take a look at the current form of each team in the Sal's NBL (last five games), along with the key stats across the season so far. It makes for interesting reading.
Form Ladder (last 5 games)
After promising starts to the season the EnviroNZ Franklin Bulls and Sky Tower Auckland Huskies are on a slide, while the SIT Zero Fees Southland Sharks and Wheeler Motor Company Canterbury Rams are the big improvers. The Mike Pero Nelson Giants are another team heading in the right direction, with the Taylor Hawke's Bay Hawks hoping their current three-game losing streak is broken quickly.
Saints 5-0
Sharks 4-1
Rams 4-1
Nuggets 3-2
Giants 3-2
Hawks 2-3
Huskies 1-4
Bulls 1-4
Jets 1-4
Airs 1-4
Points Per Game (Season)
Saints 101.3
Bulls 90.4
Jets 89.4
Sharks 88.7
Hawks 88.6
Giants 88
Huskies 87.4
Nuggets 86.3
Rams 84.9
Airs 79.1
No surprises here with the Wellington Saints leading the way (by a big margin), while at the other end two teams in the top half of the ladder (Go Media Otago Nuggets and the Rams) are at the lower end when it comes to scoring. And don't be fooled by the Property Brokers Manawatu Jets and the Bulls, who both sit in the top three for 'points for' and 'points against'.
Points Against Per Game (Season)
Bulls 95.8
Jets 95.7
Giants 91.1
Huskies 90.1
Airs 89
Hawks 88.7
Rams 87
Nuggets 84.4
Sharks 83.6
Saints 74.5
It's a perfect match for the Saints who have the highest 'points for' and the lowest 'points against'. It's no wonder they have raced to a 6-0 start to the season and lead the dash for the Final 4. Interestingly, with a current run of four successive wins, the Sharks are making their claim as a strong defensive team.
Rebounds Per Game (Season)
Nuggets 41.4
Jets 40.4
Saints 37.7
Rams 37.4
Sharks 36.4
Hawks 35.1
Airs 35
Huskies 33.8
Bulls 32
Giants 32
The presence of Sam Timmins has the Nuggets leading the way here, and no suprirse to see the Jets high on the list with both Shane Temara and DeAndre Daniels playing big minutes. A slight concern here for the Giants with a lack of tall timber one area that might bring them unstuck as the season rolls on.
Offensive Rebounds Per Game (Season)
Jets 11.7
Rams 11.3
Nuggets 10.9
Saints 10.7
Hawks 10.3
Huskies 9.9
Giants 9.2
Sharks 9.2
Bulls 7.1
Airs 7.0
While the Jets lead the way here, they are 4th on the list for second-chance points. The Sharks will be hoping to lift their offensive board numbers, while both the Bulls and Steeleformers Taranaki Airs have plenty of work ahead of them.
Assists Per Game (Season)
Airs 18.9
Saints 18.3
Rams 18.0
Sharks 17.6
Hawks 16.7
Nuggets 16.1
Huskies 15.4
Giants 14.9
Bulls 14.0
Jets 12.7
Now this will surprise people. The last-placed Airs are leading the way when it comes to assists. Why? They rank third for Field Goal %, so essentially when they do get opportunities to score they are doing so at a good clip. The warning here for all other teams is to not sleep on the Airs because they could hurt you if you're complacent.
Steals Per Game (Season)
Saints 10.3
Giants 9.1
Sharks 8.3
Huskies 7.9
Rams 7.9
Airs 7.6
Bulls 7.5
Nuggets 7.3
Jets 7.1
Hawks 6.0
Hunter Hale (Giants) and Kerwin Roach (Saints) get the most steals in the League. Enough said. The danger sign here is for the Hawks who sit bottom of the list and need to show a bit more defensively.
Blocks Per Game (Season)
Saints 4.3
Jets 3.6
Nuggets 3.6
Airs 3.1
Bulls 2.9
Sharks 2.8
Hawks 2.4
Rams 1.7
Huskies 1.6
Giants 1.6
Again no surprises that the top three rebounding teams are also the top three blocking teams. Timmins (Saints), Daniels (Jets) and Gill (Saints) also occupy three of the top four places for average blocks per game. The fourth player in that group is Marcel Jones (Airs), which unsurprisingly leads the Airs to fourth place on this list.
Turnovers Per Game (Season)
Airs 17.3
Nuggets 15.6
Jets 14.9
Bulls 14.3
Rams 14.0
Saints 13.7
Giants 13.3
Hawks 13.1
Sharks 12.2
Huskies 11.3
The list that no team wants to lead! The warning sign here sits with the Nuggets. If they hope to make the Final 4 this season then they will want to start reducing their turnovers. On the flipside, a good sign for the young Huskies who sit bottom of this list.
2pt Shooting % (Season)
Saints 64.5
Jets 57.1
Hawks 56.5
Nuggets 55.3
Bulls 54.6
Sharks 54.4
Giants 53.2
Airs 53.2
Huskies 51.9
Rams 48.0
The Jets tall timber (Temara and Daniels) has them going at a high clip, with Daishon Knight also helping here, but it's not good enough to topple the Saints who sit in a class of their own. While the Jets and Hawks deliver a high clip they will be more concerned right now at what's happening at the other end of the floor. The concern here is the Rams, but you can expect to see their lowly shooting percentage rise as the season rolls on.
3pt Shooting % (Season)
Saints 42.0
Sharks 37.1
Giants 37.0
Huskies 36.7
Bulls 35.6
Hawks 35.0
Rams 34.2
Airs 34.1
Nuggets 30.9
Jets 28.4
Dion Prewster, Taane Samuel, Troy McLean and Kenneth Tuffin have the Saints topping this list. The Nuggets won't be happy sitting so low and have some work to do, while the Jets have been disappointing beyond the arc given they have Daishon Knight, Jayden Bezzant, Nikau McCullough and Ashton McQueen.
Free Throw % (Season)
Bulls 75.8
Huskies 75.4
Sharks 75.0
Hawks 74.8
Rams 71.9
Jets 71.3
Saints 70.4
Nuggets 68.7
Giants 68.5
Airs 65.2
Read what you want into this list.